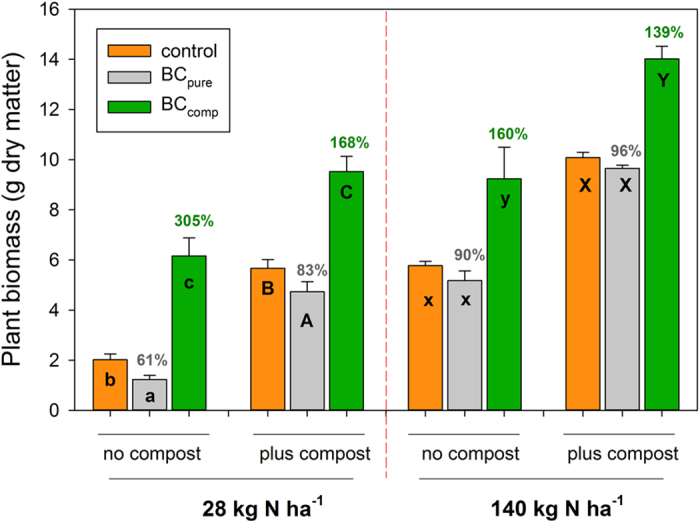
Figure 2. Total aboveground quinoa biomass at the final harvest (leaves and stems; mean + s.d., n = 4).

Control (=no biochar); BCpure untreated biochar; BCcomp composted biochar; ‘plus compost’, ‘no compost’: ±2% (w/w) compost addition; 28 and 140 kg N ha-1 indicate low and high full-compound fertilization, given by the cumulative N amount; different letters within a group of three bars indicate significant differences for ‘biochar treatment’ following three-way ANOVA (Tukey test, p < 0.05), percentage values above bars show the relative change compared to the control (=100%) within the respective tree-bar group.
