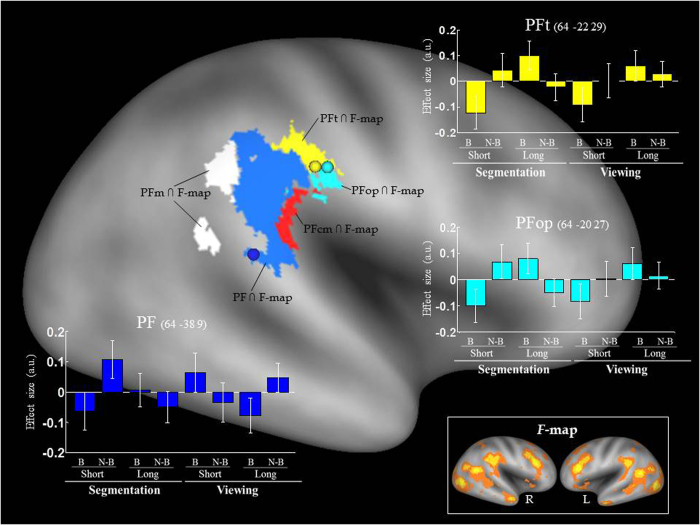
Figure 2. The VOI locations and signal plots by condition and group, and the F-map.
We projected the five volumes of interest (VOI) onto an inflated surface rendering of the right cerebral cortex (http://brainvis.wustl.edu/wiki/index.php/Caret:About)63. The coloured patches depicted the VOIs generated by intercepting each of the five relevant cytoarchitectonic areas in the rSMG (i.e., PFop, PFt, PF, PFm, PFcm)9 with the functional data (F-test). The bottom right inset shows the results of the omnibus F-test, at a low threshold of p-unc. = 0.05 (R: right hemisphere, L: left hemisphere). The signal plots for the anterior SMG shows the “Distance × Boundary” interaction [(DBORDER > Dnon-BORDER) Long > (DBORDER > Dnon-BORDER) Short] in the PFt (in yellow) and in the PFop (in cyan), whereas the signal plot for the middle SMG shows the 3-way interaction associated with the difference between the two groups in the PF (in blue). The probability of this latter peak belonging to the PF was estimated to be 50% by the SPM Anatomy toolbox64. The signal plots refer to the peak voxels (cf. spheres within the respective VOIs on the inflated surface; see also Tab. 1). Effect sizes are mean adjusted (sum to zero) and expressed in arbitrary units (a.u. ± 90% CI).

