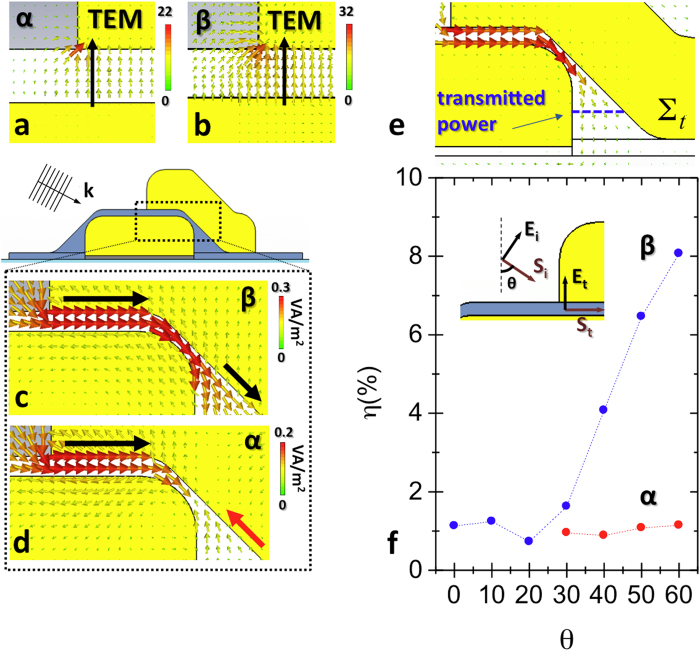
Figure 3. Propagating mode analysis.
a,b, vectorial electric field distributions respectively of α and β configurations along the MIM cavity. c,d, Poynting vector distributions respectively of β and α configurations along the MIM cavity. e, sketch depicting the profile of the surface (blue lines) on which the transmitted power associated to β and α resonances has been evaluated. f, plot reporting the ratio η between the power transmitted inside the cavity (Pt) and the impinging power (P0) as a function of the light incidence angle, in β and α resonance condition.

