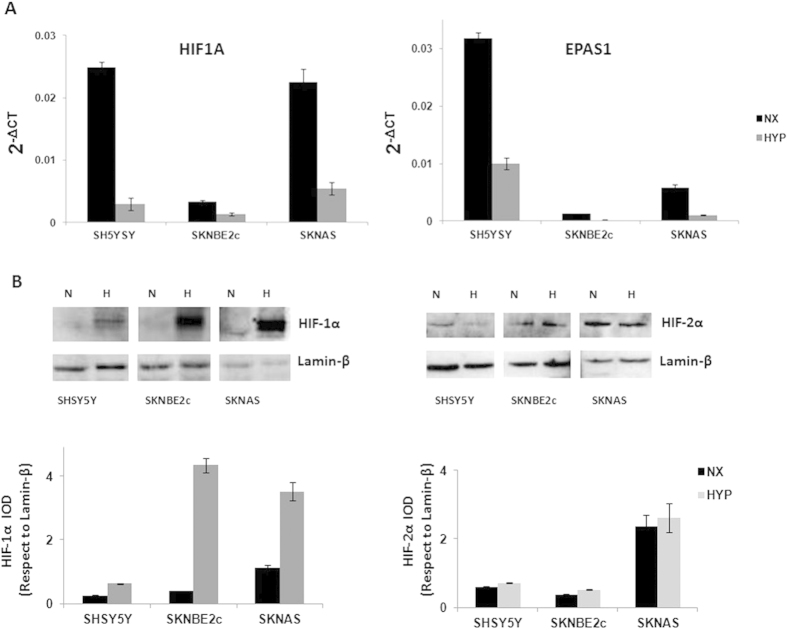
Figure 3. HIF1A and EPAS1 and HIF-1α and HIF-2α protein expression under normoxia and hypoxia conditions. The three cell lines (SHSY5Y, SKNBE2c, SKNAS) were grown in normoxia (NX) and hypoxia (HYP) (1% oxygen for 6 h).
The relative mRNA expression of HIF1A and EPAS1 normalized to β-actin expression as determined (2−ΔCT) from the RT-PCR analysis (A). Western blotting of nuclear extract from the cells grown under normoxia (N) and hypoxia (H) conditions shows HIF-1α and HIF-2α changes under hypoxia. The bands were quantified by densitometry. The bar graphs shows the integral optical density (IOD) for each band, normalized with respect to lamin-β expression (B). Data are means of three experiments.

