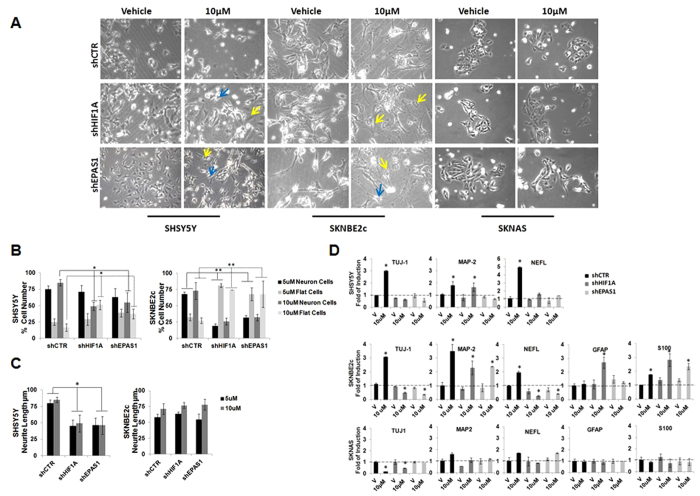
Figure 6. ATRA treatment combined with HIF1A or EPAS1 silencing enhances the glial phenotype.
(A, B) SHSY5Y, SKNBE2c, and SKNAS cells were silenced for HIF1A or EPAS1 expression (shHIF1A, shEPAS1, respectively) and treated with 5 μM (not shown) and 10 μM ATRA, or only with vehicle (V), for 6 days. Phenotypic changes were analyzed by counting the cells that showed the neuronal and flat-cell phenotypes, in six different fields for each experimental point. The data are expressed as percentages. Blue arrows, examples of neuronal cells; yellow arrows, examples of flat cells. (C) The mean neurite lengths of the counted cells (μm). (D) Gene expression analysis of TUJ-1, NEFL, GFAP and S100 performed using RT-PCR in the three NBL cell lines. Data are means of three experiments (* P ≤0.05; ** P ≤ 0.01).

