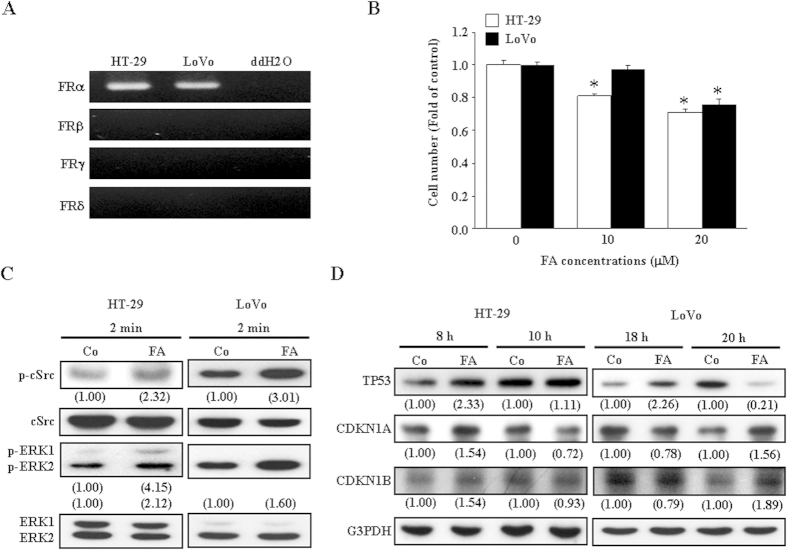
Figure 7. Effects of FA on the growth of HT-29 and LoVo colon cancer cell lines.
(A) RT-PCR demonstrated that only the FRα isoform was detected in both HT-29 and LoVo. (B) Treatment with FA reduced the growth of both HT-29 and LoVo. Media with or without FA were changed daily until cell counting. Cells were allowed to grow for 4 days after vehicle (control) or FA treatment. Values represent the means ± s.e.mean. (n = 3). * p < 0.05 different from control. (C) Treatment with FA for 2 min also increased the levels of p-c-SRC and p-ERK1/2 in HT-29. However, FA only increased the levels of p-c-SRC and p-ERK2, but not p-ERK1, in LoVo. (D) Treatment with FA for 8 h increased the levels of CDKN1A, CDKN1B and TP53 protein in HT-29 (left panel). In the FA-treated LoVo, the increased levels of TP53 protein were observed at 18 h after treatment, whereas the increased levels of CDKN1A and CDKN1B were not observed until 20 h after treatment. Values shown in parentheses represent the relative protein abundance, which has been normalized with corresponding total protein or G3PDH and expressed as fold of its own control. The entire gel pictures of Fig. 7C–D were shown in the Supplemental Figure 5A–B. Co, control; ddH2O, double-distilled water.

