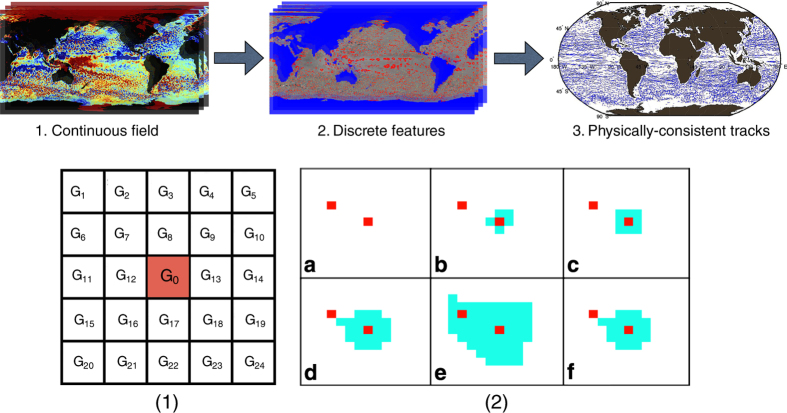
Figure 1. High-level overview of eddy identification schemes.
Top panel: a common process most autonomous eddy identification schemes follow. Starting from a continuous SLA field (left panel), discrete features are isolated from the background (red features in middle panel). Each satellite snapshot is analyzed independently, then the features from each snapshot are associated with nearby features in space and time to produce physically consistent eddy trajectories (right panel). Given the large number of features identified at each time-step, many features are discarded if they fail certain expert-defined criteria such as minimal size or minimal trajectory duration. Bottom panel: A demonstration how our proposed method identifies eddies (1) An illustration how we determine if a grid cell is an extremum. For each grid cell G0 we compare its SLA value to its 24 neighbors in a 5×5 neighborhood. G0 is labeled as an extremum if: SLA(G0)<SLA(Gi) or SLA(G0)>SLA(Gi); i=1:24. (2) The six steps that lead to identifying a cyclonic eddy. (a) All minima within the sample region are identified and highlighted in red. (b–d) Starting from the minimum at the center of the panel, iteratively threshold the SLA to find a closed-contour SLA that is greater than the minima. The eddy’s extent is highlighted in light blue. (e) The eddy’s extent engulfs two minima and the thresholding is terminated; set the feature’s contour as that of the previous step. (F) The final contour of the eddy.

