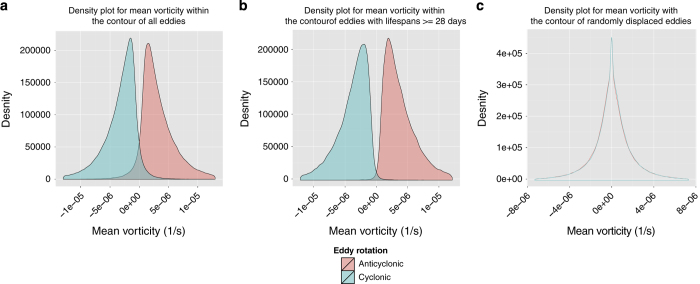
Figure 6. The distribution of mean vorticity within the contour of the eddies identified in model-output SLA in a subsection of the Southern Hemisphere.
Panel (a): the vorticity distribution for all eddies. (b): Same as (a) but excluding eddies that did not persist for 28 days. The misclassification rate is the area where the two distributions overlap. (c): The distribution of mean vorticity within the contour of eddies after they were randomly displaced from their original location.

