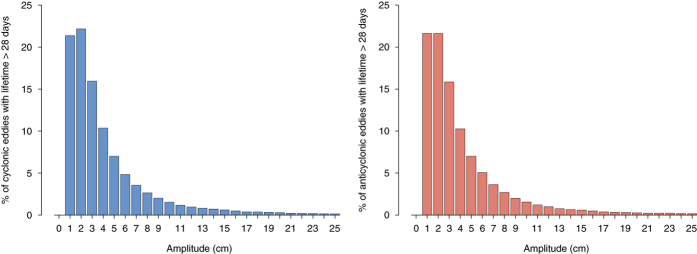
Figure 7. Distributions of the percentage of eddies with amplitude less than a certain value in model output SLA.

We selected the features with the proper vorticity sign and kept only those that persisted for more than 28 days. Cyclonic eddies are on the left (blue) while anticyclonic on the right (red). Each bar shows the percentage of eddies that persisted for more than 28 days, had the proper vorticity sign, and had an amplitude less than the value on the x-axis. Notice that 22% of these eddies have an amplitude less than one centimeter (first bar).
