Fig. 1.

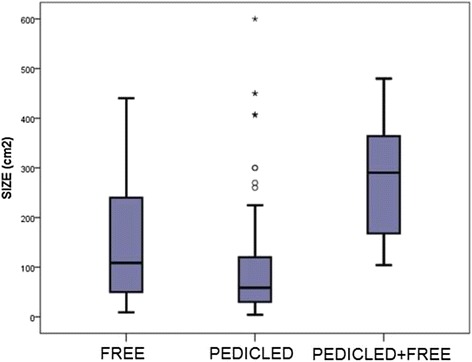
Sarcoma Defect Size Distribution. Box plot showing the distribution of flap size among the reconstructive groups. Double flap reconstructions were required for larger defect sizes (p = 0.004)

Sarcoma Defect Size Distribution. Box plot showing the distribution of flap size among the reconstructive groups. Double flap reconstructions were required for larger defect sizes (p = 0.004)