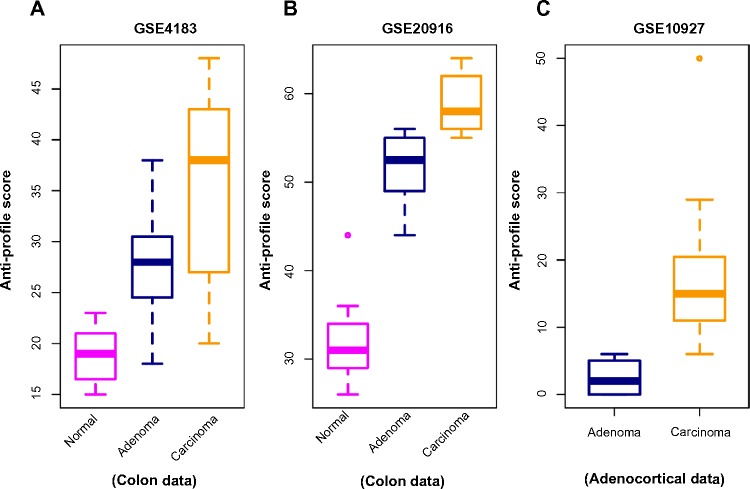
Figure 2.
Anti-profile scores calculated for tumors and normals. (A) Anti-profile scores for colon dataset (Gyorffy et al) from anti-profile computed using another colon dataset (Skrzypczak et al); carcinoma vs. adenoma AUC = 0.711 and Wilcoxon rank-sum test P-value = 0.05. (B) Anti-profile scores for Skrzypczak et al colon dataset from anti-profile computed using Gyorffy et al colon dataset; carcinoma vs. adenoma AUC = 0.97 and Wilcoxon rank-sum test P-value is <10−3. (C) Anti-profile scores for adrenocortical data (Giordano et al) from universal anti-profile probesets; AUC = 0.997 and Wilcoxon rank-sum test P-value is <10−4.

