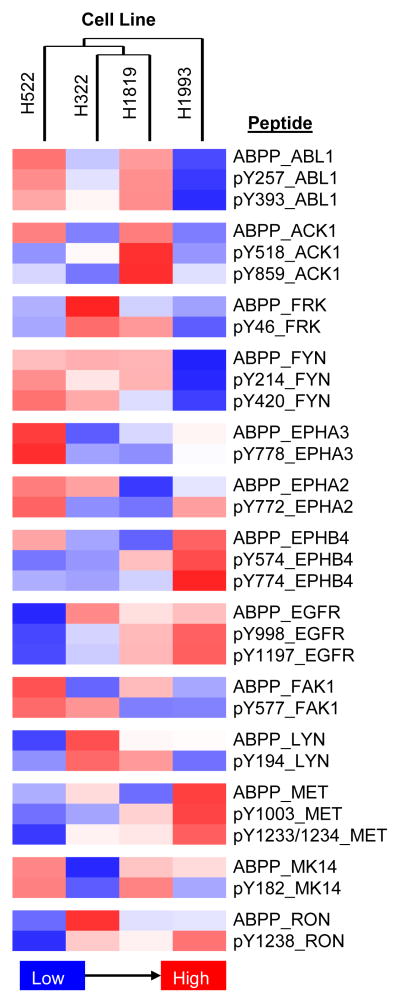
Figure 6. Heat Map of Selected ABPP and pY Relative Quantification in Four Lung Cancer Cell Lines.
Relative quantification is provided from lowest levels (blue) to highest levels (red); all peptides are detected in all samples. Correlation of the individual sites requires knowledge of the underlying biology. In many cases, the ATP uptake and the tyrosine phosphorylation correlate well (e.g. ABL1, MET). However, the pY sites may not be from autophosphorylation and thus would not be expected to correlate with ATP uptake; additional mechanisms of regulation may also play a role if the kinase activity and phosphorylation do not agree.

