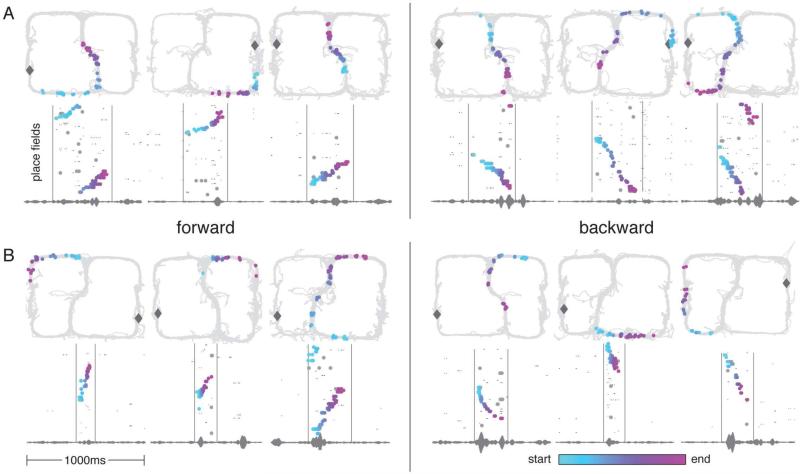
Figure 2.
Examples of forward and backward replays. (A): Examples of same-side and central stem replays (3 fwd, 3 bwd). (B): Examples of opposite-side replays (3 fwd, 3 bwd). Gray diamond indicates the rat's location at the time of the replay. On the bottom panel of each subfigure, spikes are plotted by ordered place field (spatial firing field) center (along either a left or right loop of the maze) over a one second period (see Experimental Procedures). LFPs filtered between 180 Hz and 220 Hz are plotted at the bottom of the panel. Colored points indicate spikes that contribute positively to the sequence score of the replay according to the automatic sequence detection algorithm. The color of the spike indicates its relative time within the replay (light blue = early, light purple = late). Gray points are spikes that do not contribute positively to the score. For cells with multiple place fields, small black points are plotted at every place field center belonging to the cell (colored points occupy the place field center that contributes maximally to the score). Each colored point from the bottom panel is plotted on the 2D maze in the top panel at the location of its 2D place field center. Note that forward replays could begin near the rat's location ( A, left) or on the opposite side of the maze (B, left). Similarly, backward replays could begin near the rat's location (A, right) or on the opposite side of the maze (B, right). Backward replays occurred over parts of the environment that were rarely or never experienced in the reverse direction (Figures S2 and S3).

