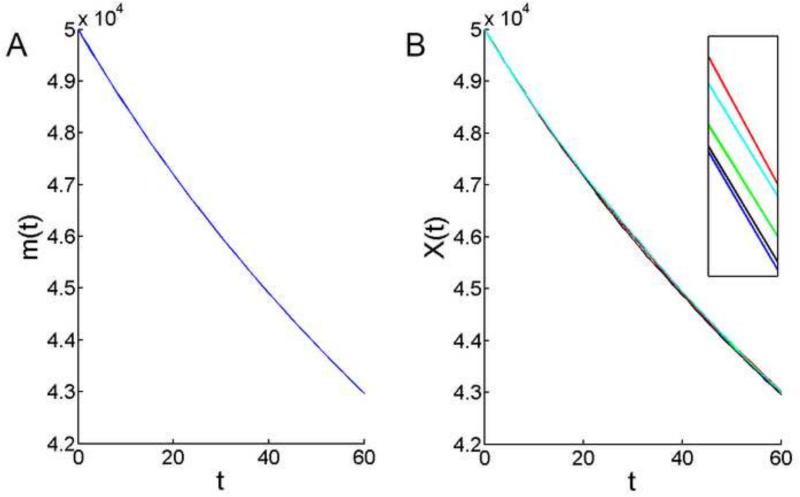
Figure 7.
Change in the total number of cells in the mouse lens epithelium, modeled over the sixty day period between 4- and 12-weeks-of-age. A. The theoretical mean based on (4.11). B. Results of five independent model simulations. Note the smooth decline in the epithelial cell population. The simulations lie close to the theoretical mean and the results of independent model runs are almost indistinguishable. In the inset, the y-axis scaling has been expanded so that the results of individual simulations can be discerned.

