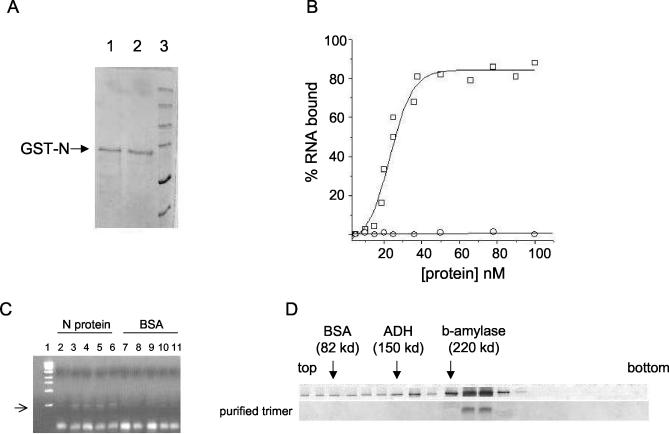
FIG. 2.
Analysis of SNV N protein expressed in E. coli. (A) SDS-PAGE analysis of purified N protein in reducing buffer (lane 1) and nonreducing buffer (lane 2). Protein markers are shown in lane 3. (B) RNA binding profile of purified N protein. Increasing concentrations of either N protein (□) or BSA (○) were incubated with S RNA as described in the text, and RNA-protein complexes were isolated and quantified by nitrocellulose filter binding with 32P-labeled RNA. (C) RNase digestion of S RNA in the presence of either N protein (lanes 2 to 6) or BSA (lanes 7 to 11) in binding buffer at room temperature for 1 min. N protein or BSA was incubated with S RNA for 1 h at room temperature and then digested for 1 min at room temperature with 1 μl of a mixture of RNases A and T1 at 40 μg/μl and 95 U/μl, respectively. After digestion RNA was isolated and purified by Trizol reagent (see Materials and Methods). RT-PCR was used to generate cDNA with random primers, and 2 μl of cDNA was used as the template in a PCR with primers specific to a 500-nucleotide-long region in the 5′ noncoding terminus of the S segment. The amplified DNA was run on a 1% agarose gel. Lane 1 contains a DNA size marker. No N protein or BSA (lane 2), 10 μM N (lane 3), 20 μM N (lane 4), 30 μM N (lane 5) 40 μM N (lane 6), 10 μM BSA (lane 7), 20 μM BSA (lane 8), 30 μM BSA (lane 9), 40 μM BSA (lane 10), and 70 μM BSA (lane 11) were used. (D) Ten to 60% sucrose gradient and Western blot analysis of bacterially expressed N protein. The top gradient contains unfractionated GST-N protein, and the bottom gradient shows purified trimeric N protein. Protein standards (BSA, alcohol dehydrogenase (ADH), and β-amylase) were run in parallel with the N samples, and the migration of those standards is indicated by arrows.

