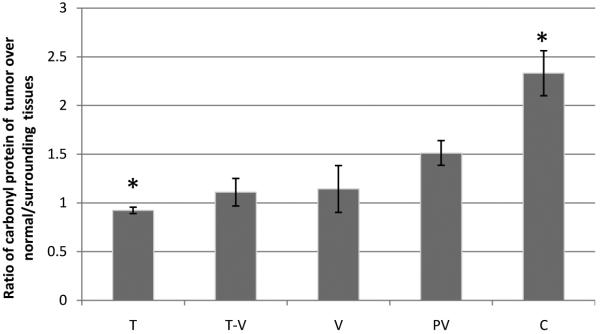
Figure 2.

Levels of reactive carbonyl proteins in normal/surrounding colorectal adenopolyps and carcinoma tissues, as measured by the spectrophotometric method. T: tubular; T-V: tubulovillous; V: villous; PV: polypvillous, C: carcinoma. Significant differences between groups (P < 0.05)*, (n = 41 pairs samples).
