
Figure 6.
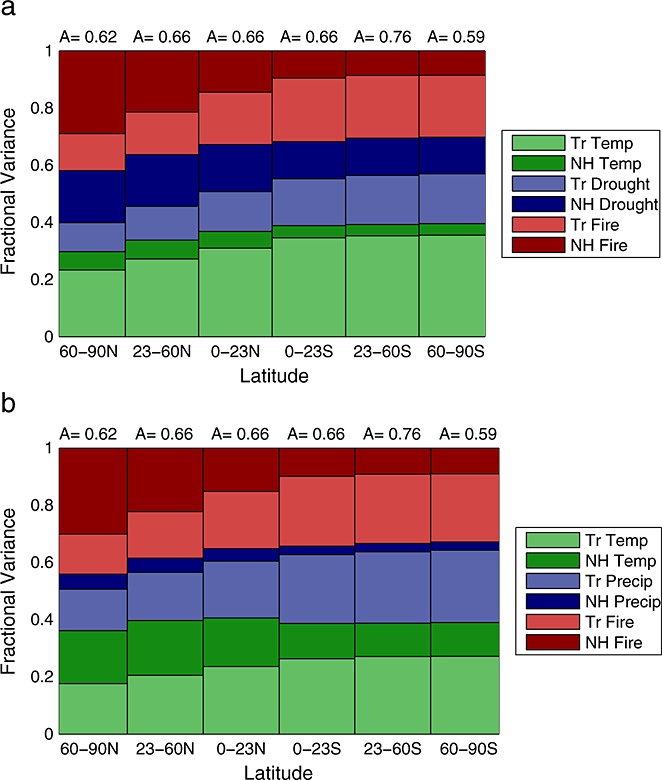
(a) Relative contributions to the simulated variability in atmospheric CO2 in different latitude bands (x axis) from NEE responses to temperature and drought stress (PDSI), and fire emissions (GFED3) originating from the tropics and Northern Hemisphere. The amplitude factor (A), calculated as the ratio of the standard deviation of the simulated CO2 relative to the standard deviation of the observations, is shown for each latitudinal band. (b) Using GPCP precipitation rather than PDSI as a drought stress metric further diminishes the contribution of tropical temperature to interannual variability in atmospheric CO2.