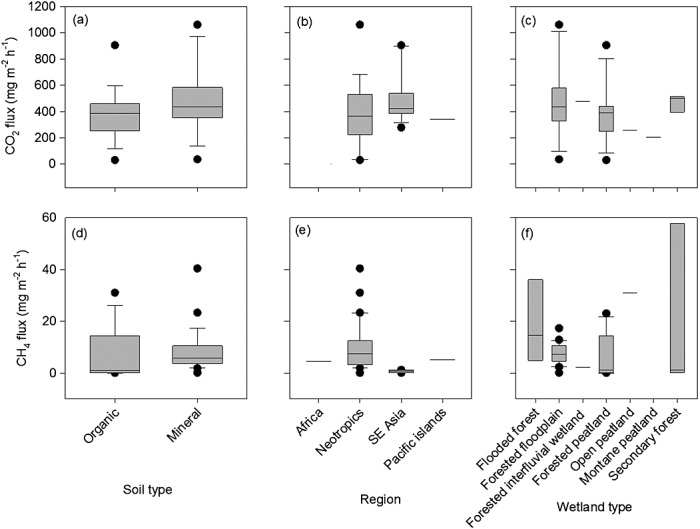
Figure 2.

Box plots comparing (a–c) CO2 and (d–f) CH4 fluxes from different: (Figures2a and 2d) soil types, (Figures2b and 2e) regions, and (Figures2c and 2f) wetland types. The box plots show the lowest and highest observations and the lowest, median, and upper quartiles as well as values which may be considered as outliers. The statistics describing these results are reported in the text.
