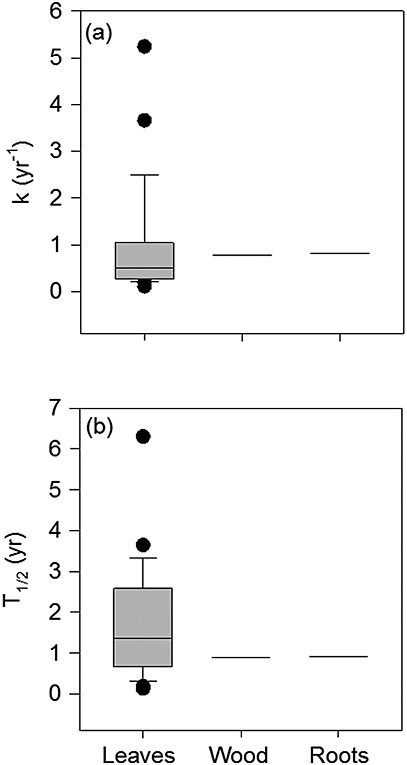
Figure 3.

Box plots showing (a) litter decay constants for different tissue types reported in the literature and (b) calculated half times for different tissue types. Data are from in situ decomposition in tropical or subtropical wetlands. Given the small sample size for wood and roots (n = 2), only the median values are shown in the graph. The box plots show the lowest and highest observations and the lower, median, and upper quartiles, as well as observations which may be considered as outliers. The statistics describing these results are reported in the text. (Values are from Furtado et al. [1980], Irmler and Furch [1980], Frangi and Lugo [1985], Brady [1997], Rejmankova [2001], Del Valle-Arango [2003], Gamage and Asaeda [2005], Chimner and Ewel [2005], Troxler and Childers [2009], and Yule and Gomez [2009]).
