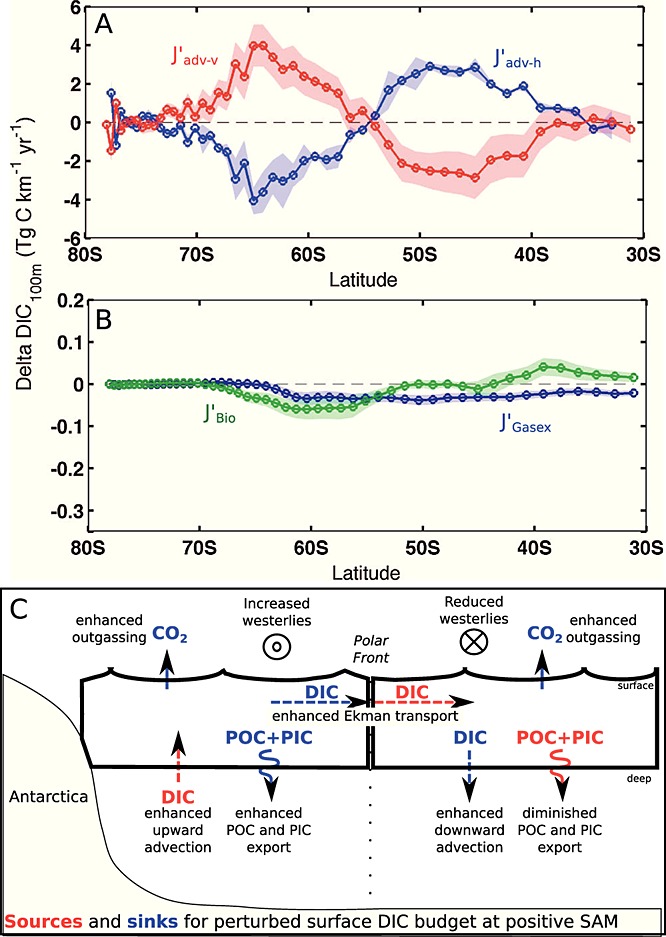
Figure 3.

Annual mean perturbation of natural carbon fluxes in the upper Southern Ocean (100 m) per one unit increase in the standardized SAM index. The 2-D fields are integrated zonally and reported per kilometer in meridional direction. Negative fluxes indicate a sink for the perturbed surface DIC inventory (more export production or more CO2 release into the atmosphere). The shaded areas show the 95% confidence intervals. (a) Contribution of vertical advection  and of divergence of horizontal advection
  . (b) Contribution of export production (
 , green) and sea-air CO2 exchange (
 , blue). (c) Idealized sketch of the perturbed carbon fluxes (red = source, blue = sink for surface DIC inventory). Dashed arrows indicate advection anomalies, solid arrows gas-exchange, and wiggled arrows export production. See Table 1 for the magnitude of the fluxes and the differences between summer and winter.
