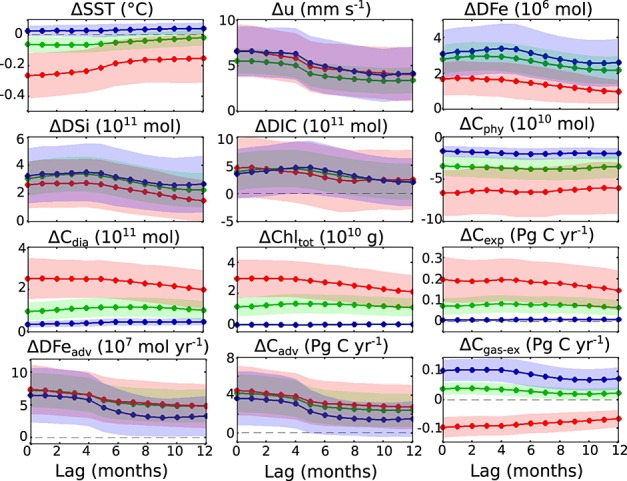
Figure 5.

The response of (as indicated in the figures) average SST, zonal velocity (u), and inventories in the 0–10 m layer of DFe, DSi, DIC, nanophytoplankton carbon biomass (Cphy), diatom carbon biomass (Cdia), total chlorophyll (Chltot), and the anomalous fluxes at 100 m for export production (Cexp), DFe (DFeadv), DIC (Cadv), and CO2 flux at the surface (Cgas-ex) plotted versus lags 0 to 12 months. Shown are the annual mean response (green), summer (red), and winter (blue) and the 95% confidence intervals of the regression south of 55°S.
