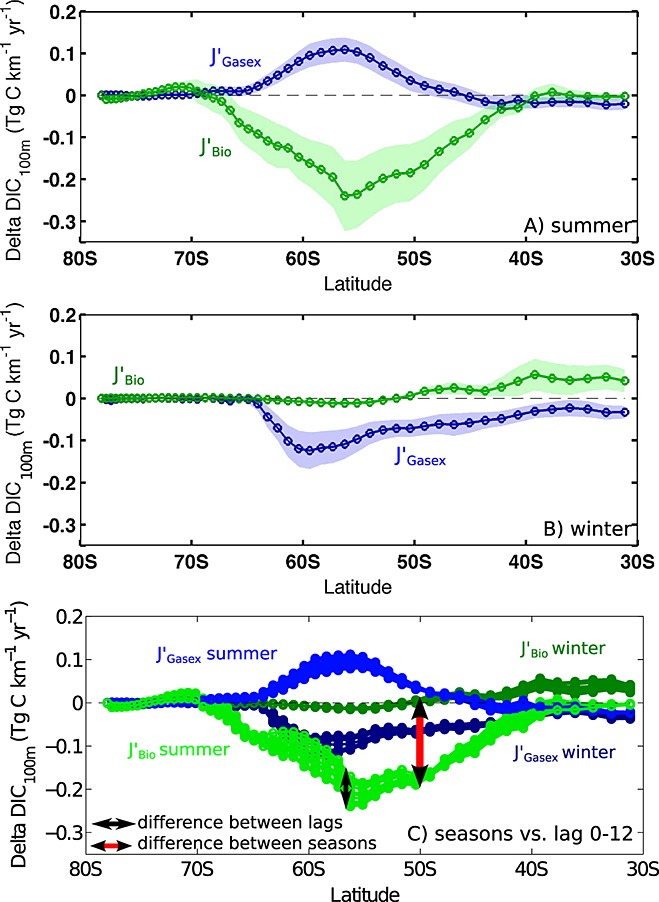
Figure 6.

Same as Figure 3b but for (a) summer and (b) winter. (c) Zonally integrated summer and winter SAM effects of gas exchange and export production on the 100 m DIC inventory, plotted simultaneously (no confidence intervals for clarity), illustrating the small differences between lags as compared to huge differences between seasons.
