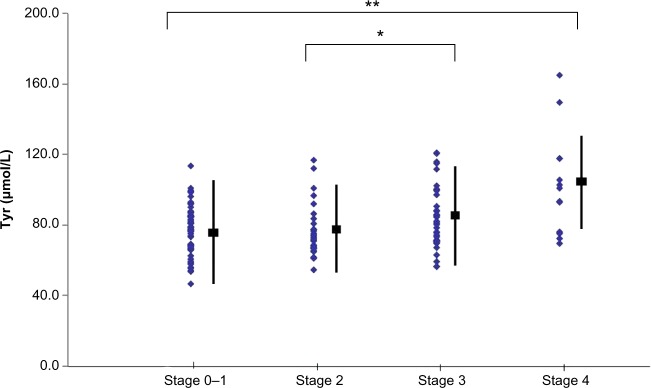
Figure 4.

Changes in tyrosine (Tyr) levels according to the progression of fibrosis.
Notes: **Stage 0–1 versus stage 4 (P<0.01); *stage 2 versus stage 3 (P<0.05).

Changes in tyrosine (Tyr) levels according to the progression of fibrosis.
Notes: **Stage 0–1 versus stage 4 (P<0.01); *stage 2 versus stage 3 (P<0.05).