
Fig. 2.
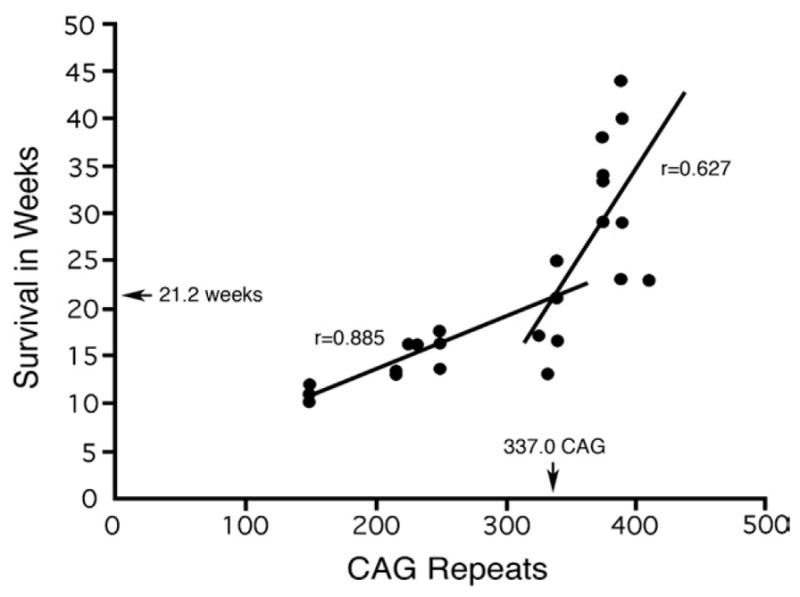
Plot of survival in weeks of mice bearing the R6/2 transgene, as a function of the size of the CAG repeat expansion in that transgene. The graph shows an abrupt increase in survival at about 335 repeats. Note that animals were sacrificed as they reached severe morbidity. Best fit linear regression lines were fit to the flat and rising portions of the survival data, and the linear correlations shown for these segments of the data were highly significant. The intersection of these two lines predicts the CAG repeat and age at which the abrupt transformation in phenotype occurred.