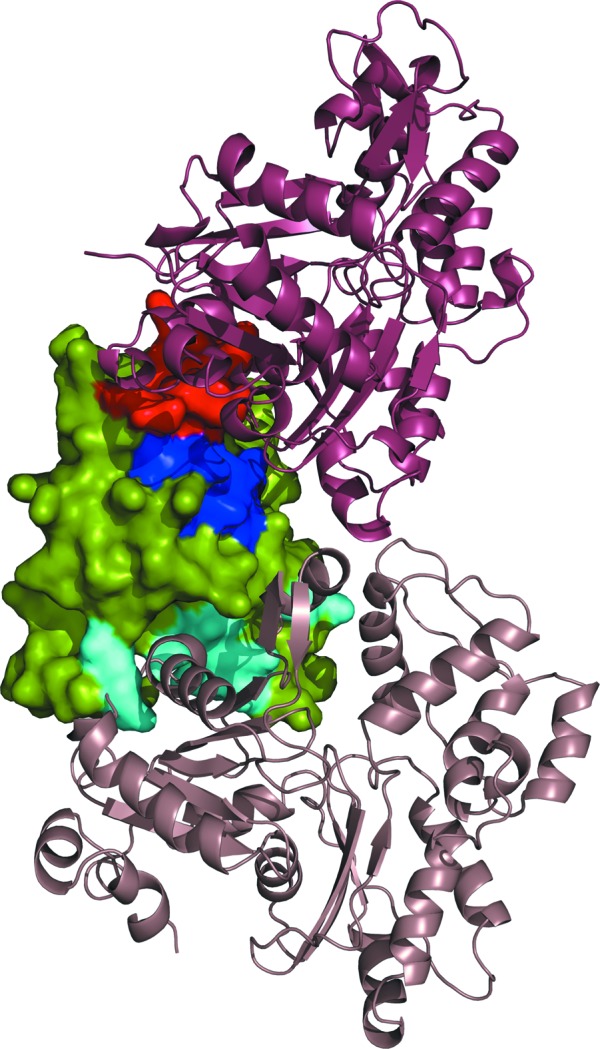
Figure 4.

Surface and cartoon representation of hCof1 (surface) and the modelled interactions with G-actin (raspberry) and F-actin (beige). The regions of hCof1 that form interactions with actin in the model are shown in dark blue. The regions that form a clash owing to helix α5 in the non-actin-binding form are shown in red and the region that is likely to be involved in the binding to F-actin on a different subunit is shown in cyan.
