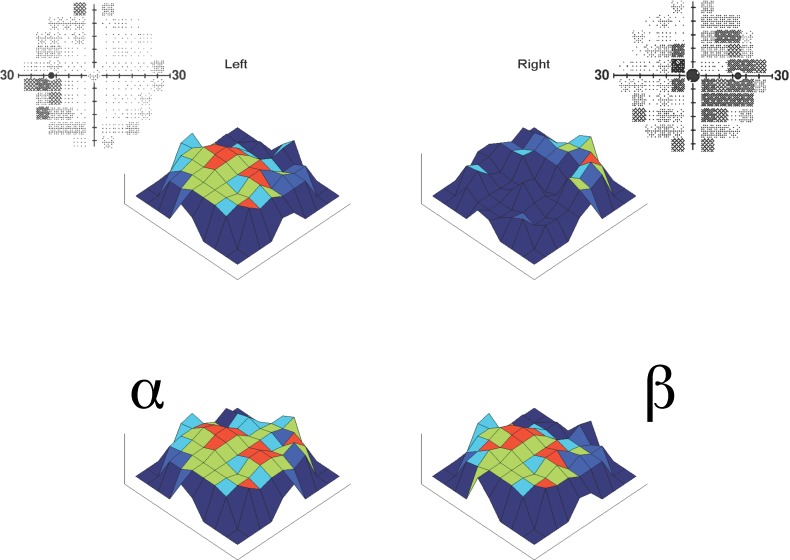
Figure 3.
Example of pairing algorithm outcomes and associated 3-D heat maps. Left and right FDT 30-2 VF pair for one subject (gray-scale 2-D, above) and associated set of heat maps (colored 3-D, below). Note that the lower left composite applying the better of each of the 69 loci (α) arising naturally for the two eyes has a much less pathologic binocular VF loss than the composite derived from isopterically equivalent randomly selected points (β) at the lower right. The probability that the mean logarithmic global light sensitivity threshold was the same for pairings (α) and (β) among all 41 subjects was < 10−9. The mean global threshold for (α) was 20.9 and for (β) 19.5 decibels.

