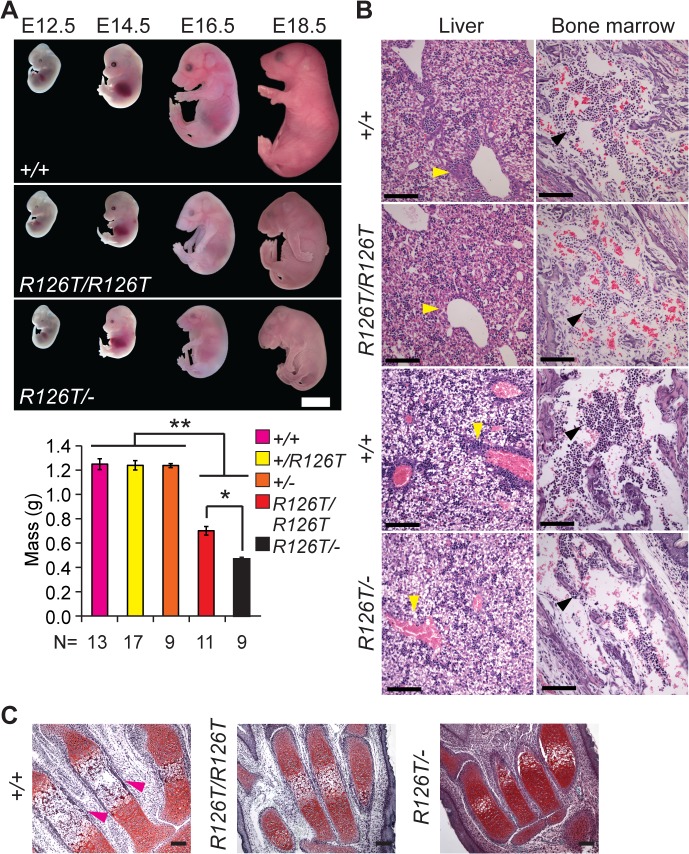
Fig 1. Sbds mutants display ribosomopathy and SDS phenotypes.
A, Embryos with biallelic mutations in Sbds have decreased mass compared with littermate controls, **P<4X10⁻⁶. Sbds R126T/–embryos are smaller than Sbds R126T/R126T embryos, *P = 1.9X10⁻⁴ (Wilcoxon Rank Sum Test; Kruskal-Wallis P = 3.0X10⁻⁸). Error bars represent ±SEM. Scale bar represents 5 mm (upper panel). B, Decreased granulocytes (dark purple, H&E, E18.5) in liver (cell cluster examples are indicated with yellow arrowheads) and bone marrow (black arrowheads) with loss of Sbds; N = 3 (Sbds R126T/R126T) and 4 (Sbds R126T/–). Scale bars represent 100 μm. C, Decreased bone ossification was observed in transverse metacarpal sections of mutants (corresponding regions of littermate controls that maintain red Safranin O staining in mutants are highlighted with magenta arrowheads, E18.5). Scale bars represent 100 μm.

