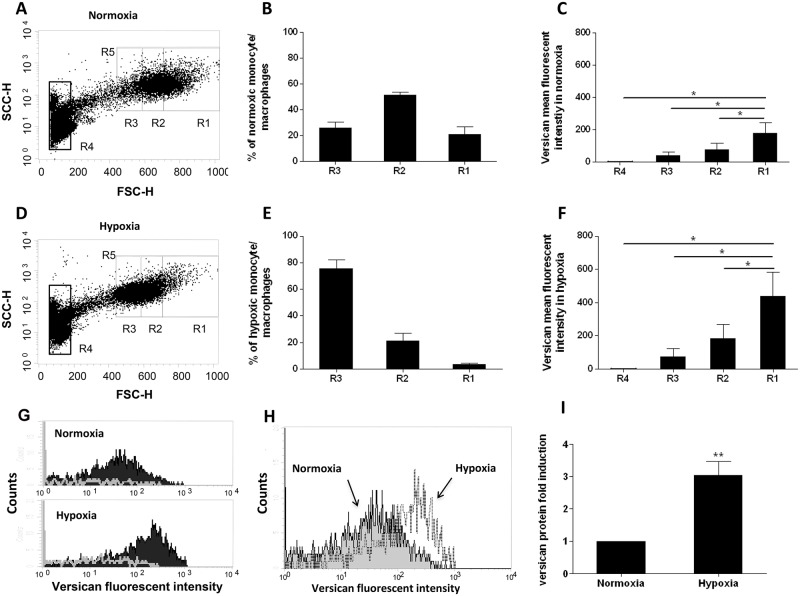
Fig 3. Quantitation of versican protein expression in monocytes / macrophages by flow cytometry.
(A and D) Dot plot analysis of PBMC after 5 days in normoxia (20.9% O2; A) and hypoxia (0.2% O2; D). Monocyte/macrophages are subdivided into 3 regions R3-R1 in respect of increasing cell size (forward scatter). Lymphocytes are included in region 4. Region 5 encompasses all monocyte macrophages in Regions 1, 2, and 3. A representative example of 5 independent experiments is shown. (B and E) Percentage of the total monocyte/macrophage population (R5) present in regions R1, R2, and R3 in normoxia (B) and hypoxia (E). Data from 5 independent experiments are expressed as means ± SEM. (C and F) Versican mean fluorescent intensity in regions 1, 2, 3 and 4 in Normoxia (C) and Hypoxia (F). Data from 5 independent experiments are expressed as means ± SEM. (G) Histogram of the fluorescent intensity with a versican specific antibody (black fill) compared to the isotype control antibody (white line) in region R1 cells in Normoxia and Hypoxia. A representative example of 5 independent experiments is shown. (H) Histogram analysis of the versican fluorescent intensity in region R1 cells in Normoxia (shaded) and Hypoxia (clear). A representative example of 5 independent experiments is shown. (I) Versican protein fold induction in cells region R1 in normoxia and hypoxia. Data from 5 independent experiments are expressed as means ± SEM. For panels B, E, C, F, and I, the normoxic value in each experiment was assigned an arbitrary value of 1. Data were further analyzed using two-tailed, paired t-tests. ** p < 0.01,* = p <0.05.

