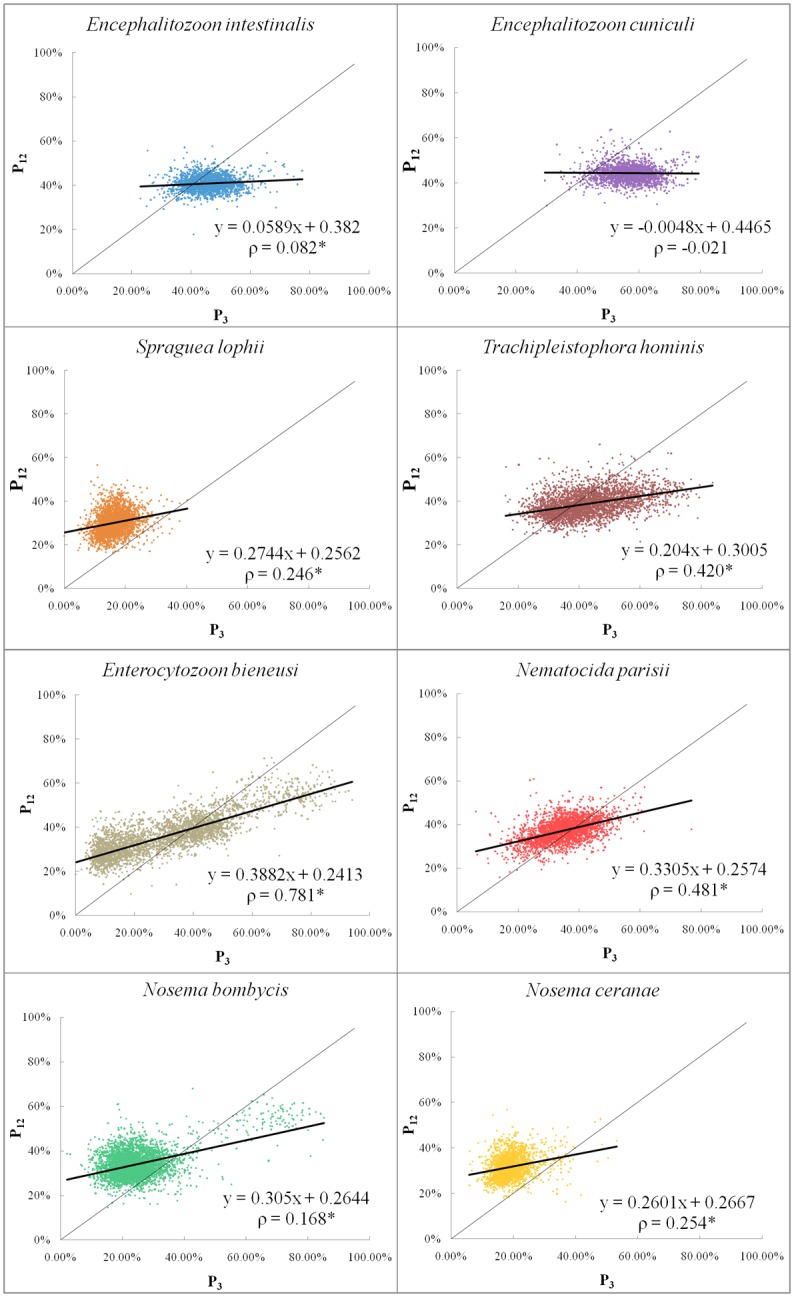
Fig 4. Neutrality plots of microsporidian genomes.

Individual genes are plotted based on the mean GC content in the first and second codon position (P12) versus the GC content of the third codon position (P3). Regression lines and Spearman’s rank correlation coefficients (ρ) are shown, with the asterisk (*) denoting P-values < 0.01.
