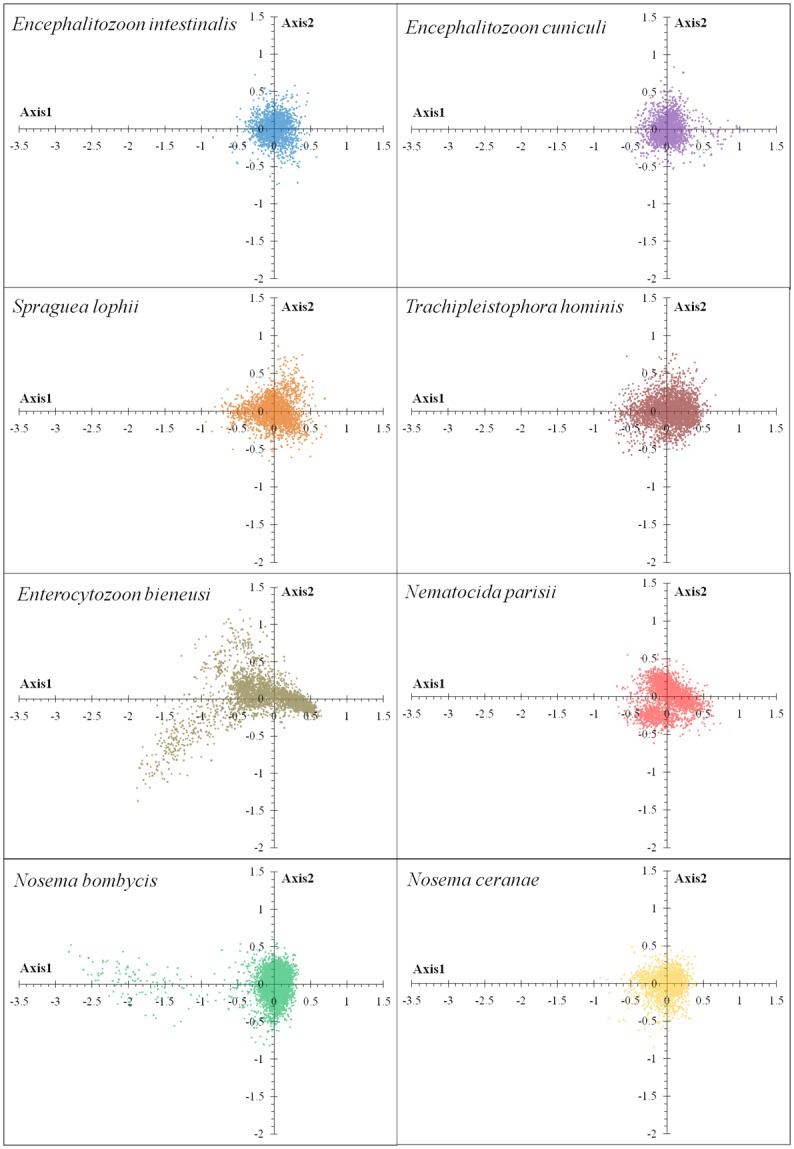
Fig 5. The correspondence analysis (COA) of the genes in microsporidian genomes.

Each point represents a gene corresponding to the coordinates of the first and second axes of variation generated from the correspondence analysis. Some E. bieneusi and N. bombycis genes scattered to the left of Axis 1 might have distinct codon usage biases.
