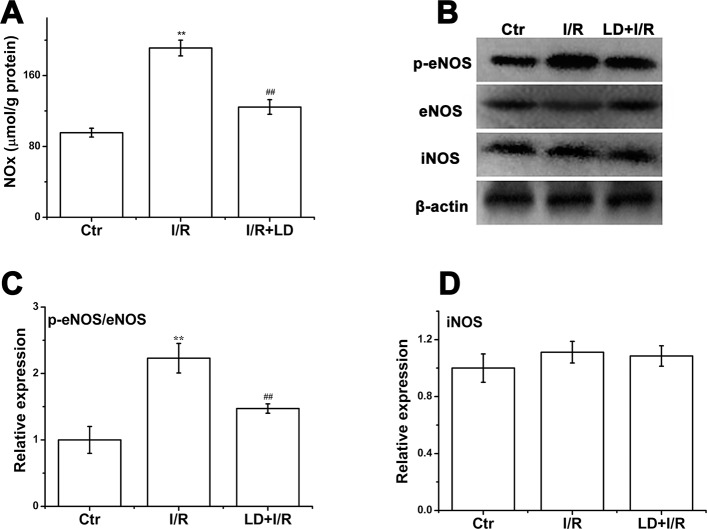
Fig 10. Effect of LD on NO production, iNOS protein expression, and eNOS phosphorylation.
(A) The level of NO production. (B) The protein expression of total eNOS, phosphorylaed eNOS, and iNOS and were analyzed via Western blot. (C) Quantitative analysis of phosphorylaed eNOS/ total eNOS protein level. (D) Quantitative analysis of iNOS protein level. ** P<0.01 compared with control group; ## P<0.01 compared with I/R group.

