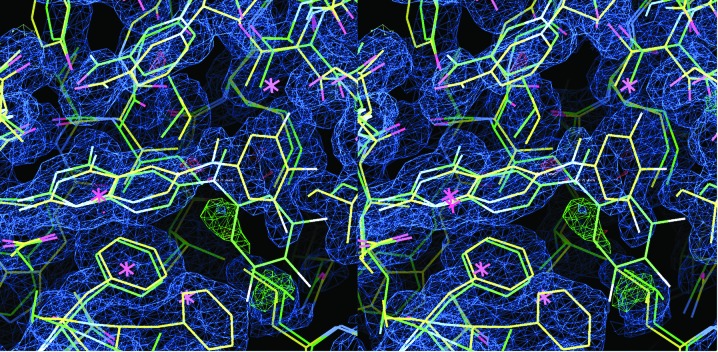
Figure 3.
Stereo comparison of the 2F o − F c difference electron-density map (1σ) for the hDHFR–26–NADPH ternary complex (yellow) with the fit of the pcDHFR–26–NADPH complex (green). Also shown is the 3.5σ F o − F c density (green), which has a partial fit for an alternate conformation of the trifluorophenyl ring as observed in the pcDHFR complex (green).

