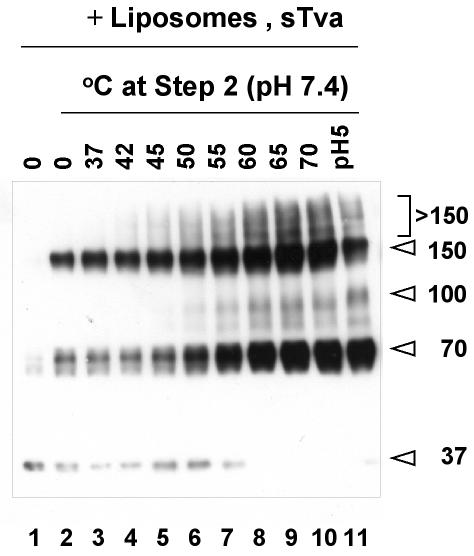
FIG. 2.
Effects of an increased temperature, in lieu of a low pH, at step 2 on conformational states of EnvA TM. Virions (lane 1) were treated to step 1 conditions (lane 2) and then to the indicated temperature (instead of a low pH) at step 2 (lanes 3 to 10). Lane 11 is a sample of virions treated to the two-step protocol. Samples were processed to visualize EnvA TM as described in the legend to Fig. 1. The values on the right are molecular sizes in kilodaltons.

