FIGURE 3.

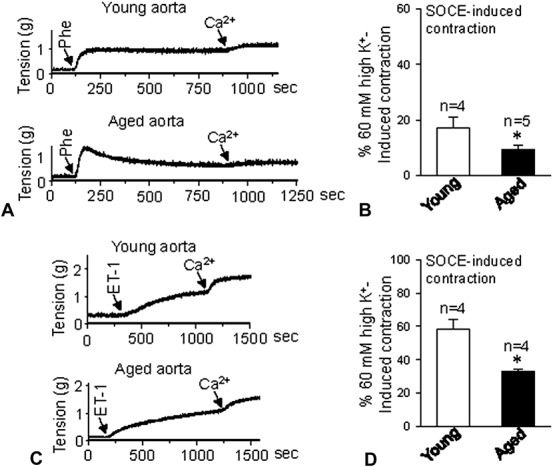
Agonist-induced contraction in the aorta. Representative traces of 2.5 mM Ca2+ application-induced vessel contraction after 1 μM Phe (A) or 10 nM ET-1 (C) treatment for 10 minutes in aorta from young and aged rats. B and D, show vessel tension changes in response to extracellular Ca2+ application after Phe (B) or ET-1 (D) treatment in aortas from young and aged rats. Values are presented as the mean ± SEM (n = 4–5); *P < 0.05. Young (3 months old) versus aged (22 months old).
