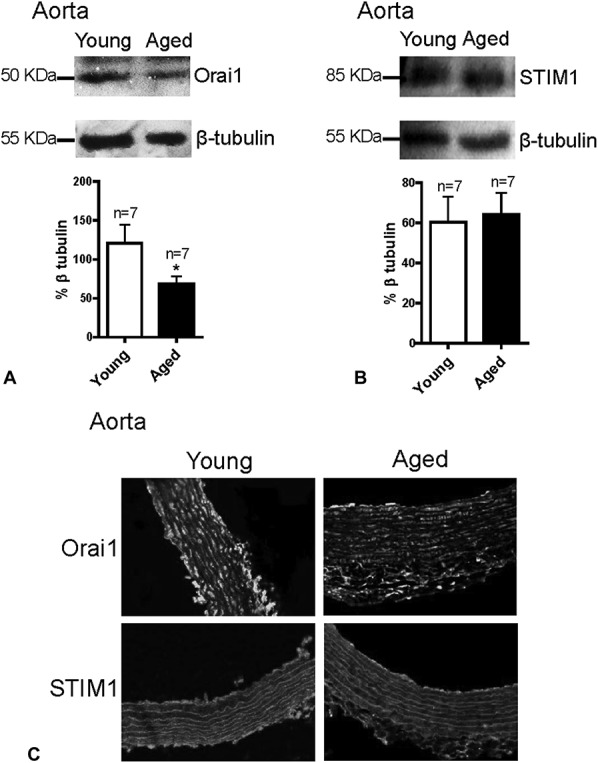
FIGURE 6.

Expression levels of Orai1 and STIM1 in aorta. Western blot and inmmunofluorescence staining images and summarized data showing the expression levels of Orai1 (A and C) and STIM1 (B and C) in aorta from young and aged rats. The expression levels of proteins were normalized with β-tubulin and are expressed as the relative optical density. Mean ± SEM (n = 7); *P < 0.05. Young (3 months old) versus aged (22 months old).
