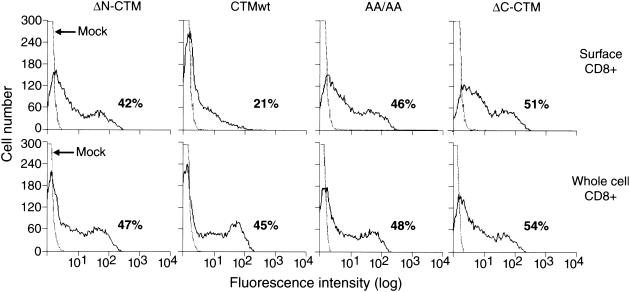
FIG. 4.
Display of CD8-CTM chimeric proteins on the cell surface. At 24 h after transfection, intact COS-7 cells were stained with PE-conjugated anti-CD8 antibody and analyzed by flow cytometry for surface display of CD8-CTM chimeric proteins (top panels). The total population of cells containing chimeric proteins was measured in parallel samples that were permeabilized and stained with the same antibody (bottom panels). Each panel shows a histogram of mock-transfected cells (dotted line) as well as a histogram generated by cells expressing one of the following chimeric proteins: ΔN-CTM, CTMwt, AA/AA, or ΔC-CTM (solid line). The percentage of cells staining for CD8 above the background staining of mock-transfected cells is shown on the lower right of each panel. Representative results from a single experiment are shown.

