
Figure 7.
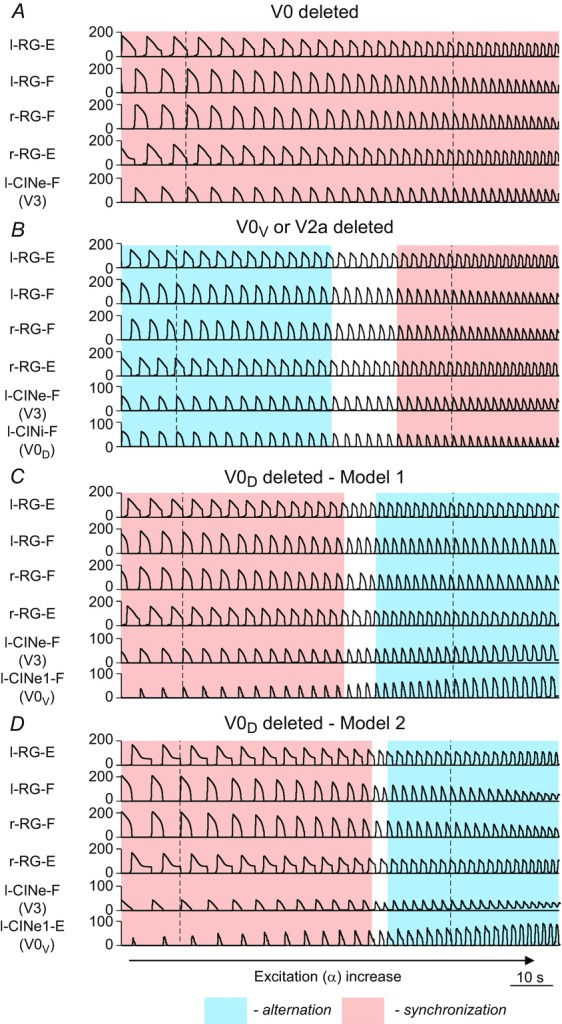
Performance of the reduced models in response to slow ramp increase of neuronal excitation
A, performance of both models after removal of both V0 (V0V and V0D) CIN populations. B, performance of both models after selective removal of V0V CIN or V2a populations. C and D, performance Model 1 (C) and Model 2 (D) after selective removal of V0D CIN populations. Parameter α was increased for 200 s from 0.03 to 0.09 in A, from 0.05 to 0.09 in B, from 0.04 to 0.09 in C, and from 0.02 to 0.09 in D. In all panels, the activity of all centres and remaining (left) CIN populations is shown as average histogram of neuron activity [spikes/(neuron × s), bin = 100 ms]. The vertical dashed lines indicate the beginning of the left flexor phases at lower and higher values of α (and oscillation frequency). The regions of left–right alternating and left–right synchronized activity are highlighted by the blue and pink rectangles, respectively. CIN, commissural interneuron; -E, extensor; -F, flexor; l-, left; r-, right; RG, rhythm generator.