
Figure 8.
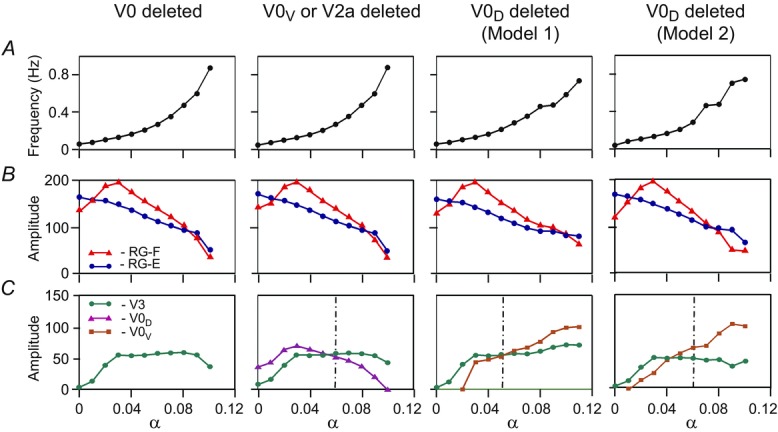
Changes of the key characteristics in the reduced models in response to a stepwise increase of neuronal excitation
The left column shows the results for both models after removal of both V0 CIN populations. The second column represents the results for both models after selective removal of V0V CIN or V2a populations. The third and the fourth columns show the results for Model 1 and Model 2, respectively, after selective removal of V0D CIN populations. Each column shows: A, frequency of oscillation; B, amplitude of activity of flexor (l-RG-F, red) and extensor (l-RG-E, blue) centres; C, amplitude of activity of V3 (l-CINe-F, green), V0D (l-CINi-F, purple), and V0V (l-CINe1-F in Model 1 or CINe-E in Model 2, brown) CIN populations. The dash-dotted vertical lines indicate transitions between left–right alternation and left–right synchronization phase transitions. CIN, commissural interneuron; -E, extensor; -F, flexor; l-, left; r-, right; RG, rhythm generator.