
Figure 9.
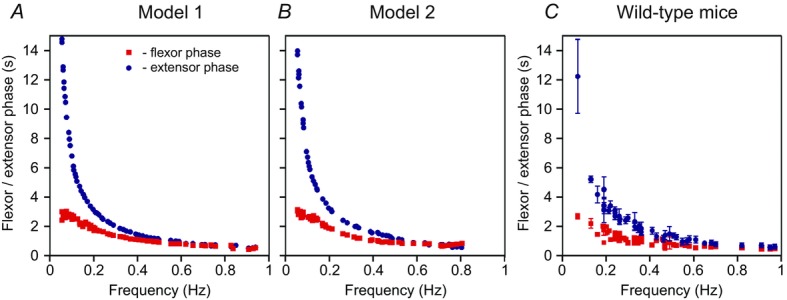
Changes in flexor and extensor phase durations as a function of locomotor frequency
A, Model 1. B, Model 2. C, experimental studies in wild-type mice. In all panels, red filled squares and blue filled circles show average flexor or extensor phase lengths. A and B, data for 62 simulations are shown. In each simulation, parameter α was randomly chosen from a corresponding range α ( [0, 0.12] for Model 1 and
  [0, 0.1] for Model 2) and all model parameters and initial conditions were randomly redistributed. The settling period allotted before data were collected varied from 10 s (for the highest values of α) up to 100 s (for the lowest values of α). For each set of data, the oscillation frequency and flexor and extensor phase durations were averaged for 10–20 cycles. The graph in C was generated from data sampled in Talpalar et al. (2013).