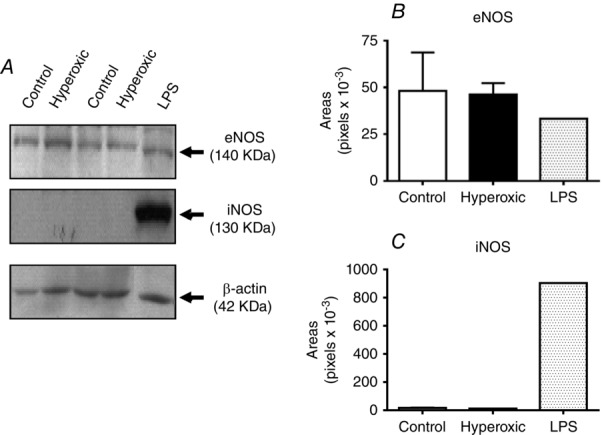
Figure 2.

Level of expression of eNOS and iNOS in pulmonary arteries of control, hyperoxic and LPS-treated rats
A, sample western blot analysis obtained in the different experimental conditions. Note that the level of eNOS expression in every condition is comparable; note also that iNOS was only visible in the lane corresponding to a tissue sample obtained form a LPS-treated rat. B, mean densities of the eNOS bands in the three experimental conditions, showing that they are comparable. C, by contrast, iNOS band density was minimal, barely above background in control and hyperoxic tissues, and it was very intense in the tissue of LPS-treated animals.
