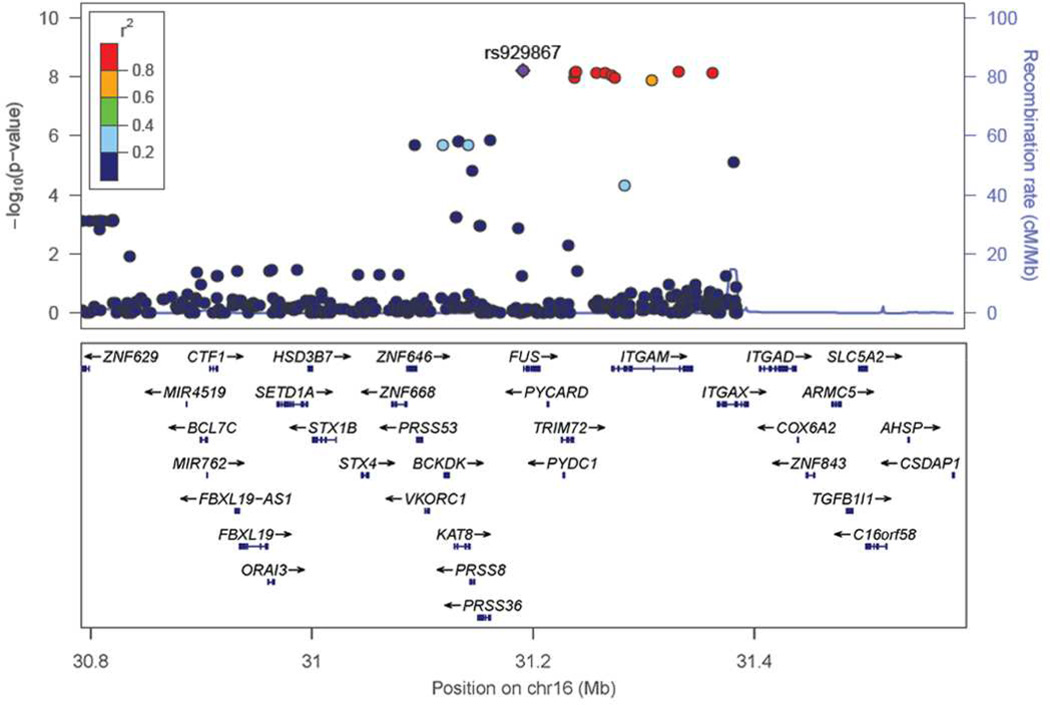
Figure 2.
Regional association plot at the 16p11.2 (ITGAM) locus. SNPs are plotted by chromosomal position in a 400-kb window against their −log10 transformed P values for association with CVID phenotype in the discovery cohort. The color of each SNP reflects their LD with the most significant rs929867. The r2 values were calculated from the discovery cohort in PLINK.

