Fig. 2.
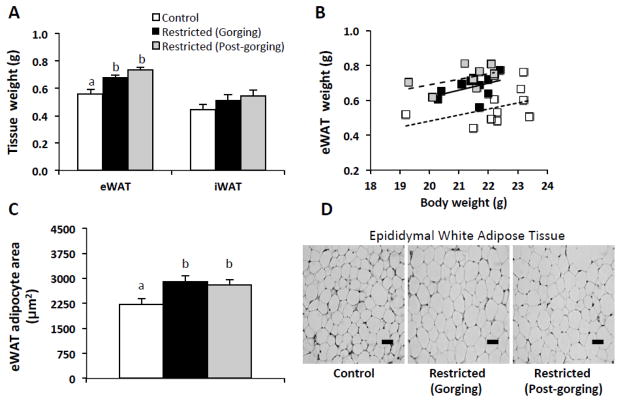
Adipose tissue mass and adipocyte size in refed Restricted mice by metabolic state and relative to ad-libitum fed Controls. (A) White adipose tissue weights, n=10 per group. (B) eWAT mass by body weight. eWAT mass was significantly higher in both Restricted groups compared to Control mice by ANCOVA with body weight as a covariate (p < 0.001, post hoc LSD tests; n=10 per group). (C) eWAT adipocyte cross-sectional area, 150 cells/mouse x 8–10 mice per group. (D) Representative images of H&E stained eWAT revealing effects of restriction-triggered gorging on adipocyte morphology. Magnification: 200x; Scale Bar: 50μm. Data in A and C were analyzed using one-way ANOVA with post hoc Tukey’s test. Different letters indicate statistically significant differences among groups, p < 0.05. eWAT, epididymal white adipose tissue; iWAT, inguinal white adipose tissue.

