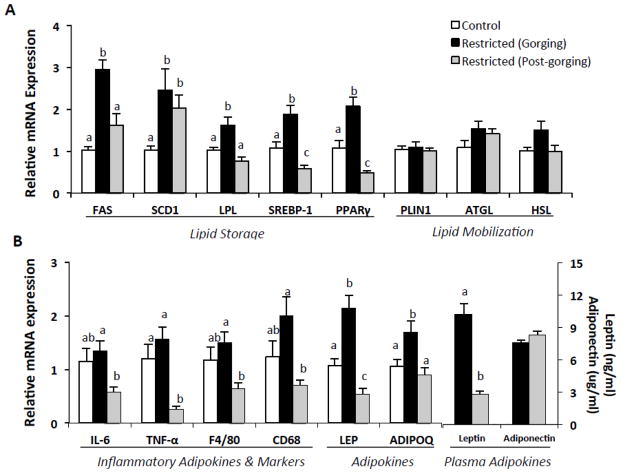
Fig. 5.
Gene expressions in epididymal white adipose tissue in refed Restricted mice by metabolic state and relative to ad-libitum fed Controls. (A) Adipo/lipogenic and lipolytic mRNA expression. (B) Adipokines and inflammatory marker mRNA expression and plasma adipokines. Values represent means ± s.e.m., n=7–10 per group. Data were analyzed using one-way ANOVA with post hoc Tukey’s test. SCD1, LPL, SREBP-1, PPARγ, TNF-α, CD68, and LEP were transformed for statistical analysis. Untransformed means are presented for relevance. Different letters indicate statistically significant differences among groups, p < 0.05. ADIPOQ, adiponectin; ATGL, adipose triglyceride lipase; CD36, fatty acid translocase, cluster of differentiation 36; CD68, cluster of differentiation 68; F4/80, EGF-like module-containing mucin-like hormone receptor-like 1; FAS, fatty acid synthase; HSL, hormone-sensitive lipase; IL-6, interleukin 6; LEP, leptin; LPL, lipoprotein lipase; PLIN1, perilipin-1; PPARγ, peroxisome proliferator-activated receptor gamma; SCD1, stearoyl-CoA desaturase-1; SREBP-1, sterol regulatory element-binding protein-1; TNF-α, tumor necrosis factor α.

