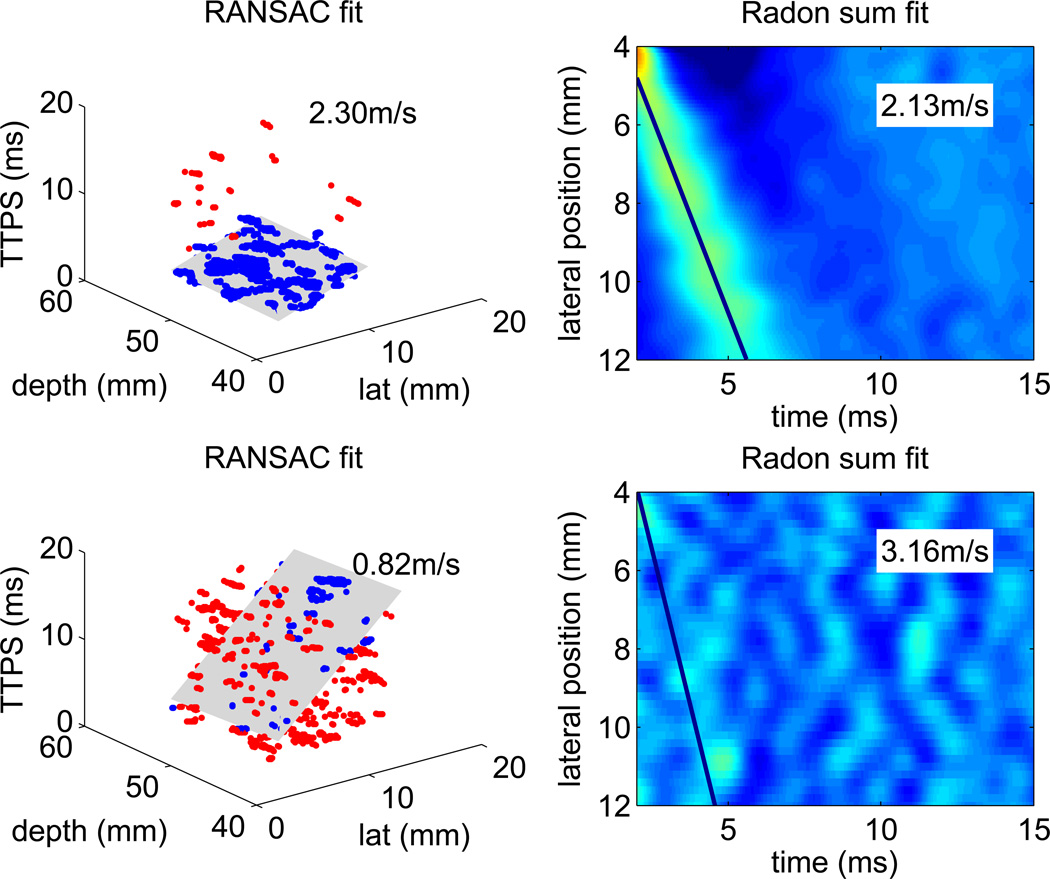
Figure 2.
Example RANSAC and Radon sum SWS reconstructions. In the RANSAC data, the blue points depict inliers of shear wave arrival times, while the red points depict outliers. The gray plane shows the 3D plane that best fits the arrival time profile. In the Radon sum data, which was averaged through depth, the line depicts the best fit that approximates the shear wave trajectory. Each pixel indicates the peak particle velocity ranging from −5 – 15 mm/s, The top row shows the RANSAC and Radon sum fit of a successful SWS reconstruction, there were 98% inliers in the RANSAC fit, and the estimates are within 8% of each other. The bottom row shows an unsuccessful SWS reconstruction, where the data is so noisy that no shear wave propagation is evident. There were only 28% inliers in RANSAC fit, and the RANSAC and Radon sum fits were arbitrary, with the SWS estimates differing by 75%.

