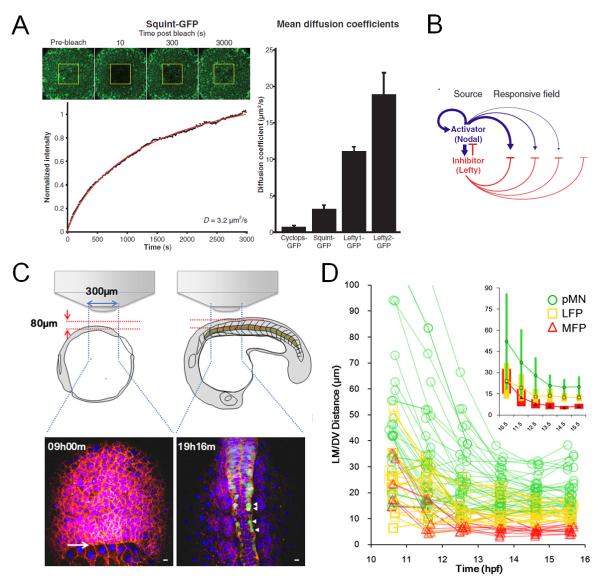
Figure 5. Morphogen patterning dynamics studied using live imaging.
A. Using Fluorescence recovery after photobleaching (FRAP) to measure the diffusion coefficients of tagged morphogen molecules (Squint as example here). The recovery profile (black) was fit with simulated recovery curves (red). The plot shows a summary of measured diffusion coefficients. Image reprinted with permission from ref. 31.
B. Model diagram of the activator/inhibitor reaction-diffusion system for Nodal/Lefty morphogens, the diffusivities of activator and inhibitors are essential for the patterning system. Image reprinted with permission from ref. 31.
C. Schematic illustration of imaging setup for neural tube live imaging and sample data time points. Image adapted from ref. 32.
D. Positional trajectories of cells of different fates. Inset shows population average position ± SD (colored bars) by cell type plotted on the same axes. Cells show rearrangement of positions during the patterning process, an observation made possible by live imaging based cell tracking. Image adapted from ref. 32.

