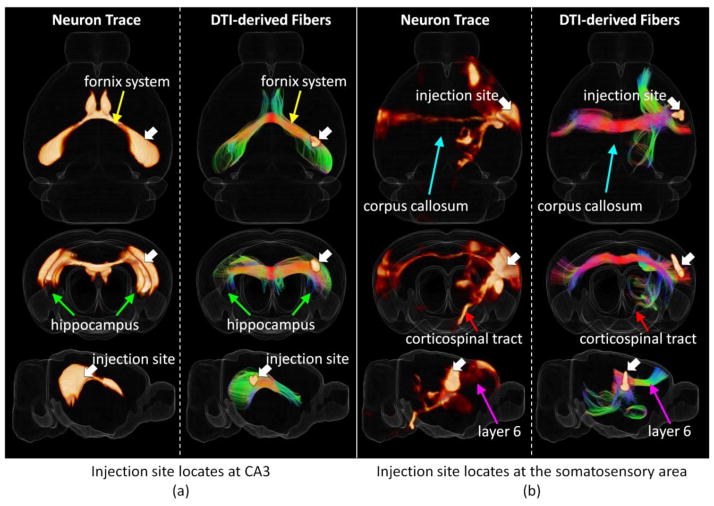
Figure 1.
Two examples of a joint 3D view of neuron tracers and the corresponding DTI derived axonal fibers (with Hausdorff distance smaller than 0.5 mm) from different views. For each sub-figure, 3D rendering of tracer density is shown on the left and the corresponding DTI fiber tracks are shown on the right together with injection sites highlighted by white arrows. A transparent reconstructed cortical surface is also shown in each figure. (a) Injection site locates at CA3. (b) Injection site locates at the somatosensory area.

