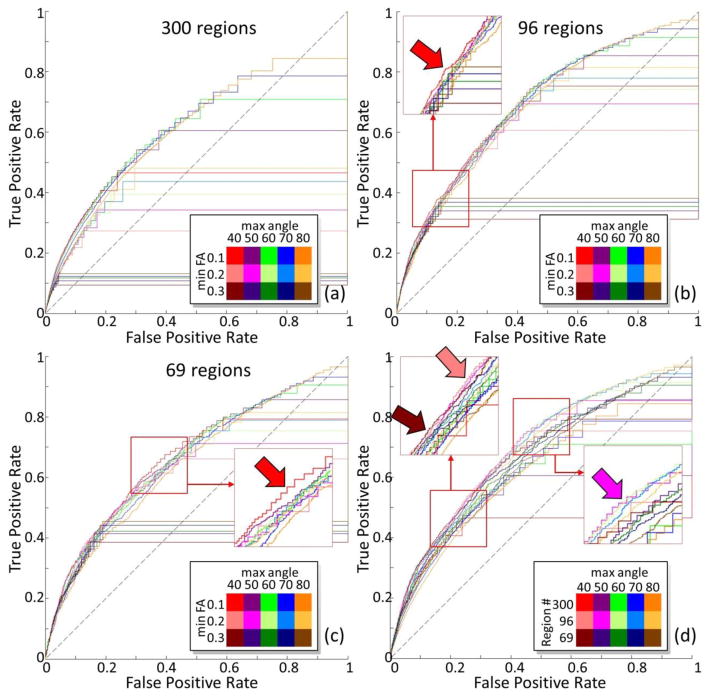
Figure 3.
ROC curve for DTI derived contralateral connectome with different parameters using different percolation schemes by taking tracing experiments based connectivity as truth. The fiber tracking termination angle varies from 40 degree to 80 degree. The FA threshold for fiber tracking to start and stop varies from 0.1 to 0.3. For each combination of tractography parameters, a ROC curve is generated with the threshold of fiber number to establish connectivity changes alone the curve. Color legend is shown on right bottom of each sub-figure. (a),(b),(c): the brain is parcellated into 300, 96, and 69 regions accordingly. (d) When the FA threshold is 0.1, comparisons across different parcellation scales are shown.

