
Figure 4.
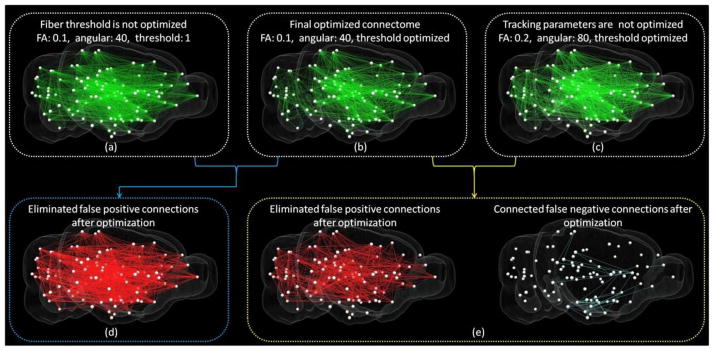
Examples of improvements of DTI derived connectome after parameter optimization. Whole brain is annotated by 96 regions with the center of each one represented by white sphere. (a)–(c): Visualization of ipsilateral connectome derived from DTI tractography when different parameters were selected. Result based on optimal parameters is shown in (b). In (a), threshold of fiber number to establish connection is not optimized and set to 1. In (c), the parameters for fiber tracking are not optimized. (d) Visualization of eliminated false positive connections from the result shown in (a) after optimizing fiber threshold. (e) Visualization of improvements from the result shown in (c) after optimizing tracking parameters.