Figure 5.
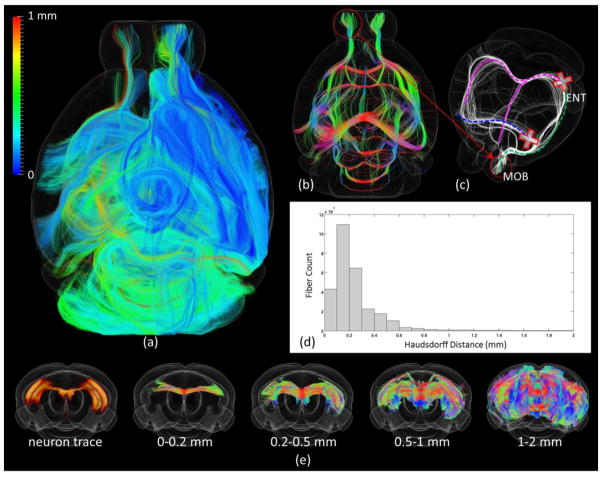
(a) Visualization of fibers projected to/from the right hemisphere. Each fiber is color-coded by its SHD to all the neuron tracer volumes (color bar on the top left). Fibers were set transparent for better visualization. (b) Visualization of all the fibers with SHD larger than 1mm. Fibers are color coded by local orientations. (c) Manually selected fibers that have SHD larger than 1mm from the left main olfactory bulb (MOB) as highlighted by the red circle. (d) Histogram of SHD for all fibers projected to/from the right hemisphere. (e) Visualization of fibers with certain Hausdorff distance to the neuron trace shown on the left.

