
Figure 6.
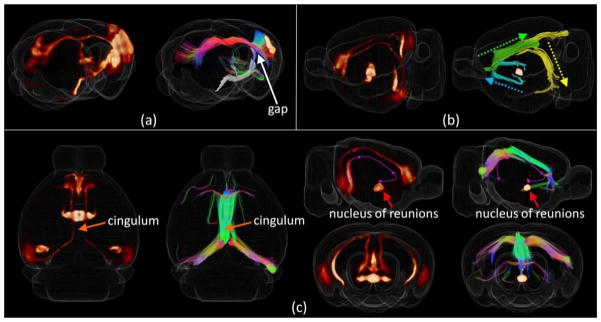
3D visualizations of the neuron tracing volume (left) and the corresponding fiber tracks (right) with type II error. (a) For the study shown in Figure 1(b), cortical-spinal projections were manually selected and highlighted by the white curves. A gap can be clearly observed between fiber streamlines and the cortex as highlighted by the white arrow. (b)–(c) A neuron tracing study with injection site locates in the nucleus of reunions (RE). As highlighted by the magenta dash curve, the connection follows the cingulum and is projected to the entorhinal area and CA1. Though the corresponding DTI streamlines were identified successfully, it is broken down into 3 segments as represented by the azure, green, and yellow curves shown in (b).